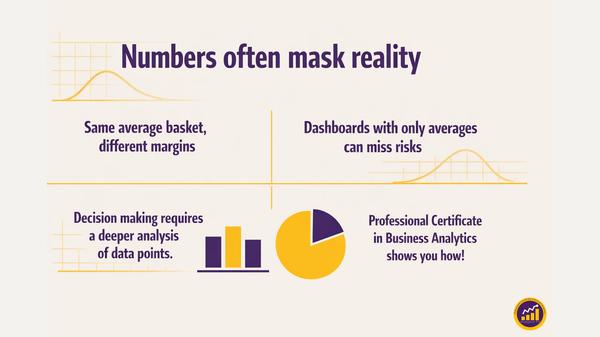
Two stores report the same average basket size. One is thriving. The other is struggling. That gap is a simple economics story and a powerful warning: a single average can hide real business risk.
Why Averages Can Mislead
An average compresses all baskets into one number. It does not show:
- How many customers sit in the healthy middle
- How many baskets are very small
- How much a few very large baskets are pulling up the mean
- How discounts are propping up that average
Imagine both Store A and Store B report an average basket of 42 dollars. In Store A, most customers cluster around 42. The middle is strong, behavior is stable, and demand looks predictable. Here, the mean reflects a real, healthy center of gravity.
In Store B, many customers buy only low value items, the middle is thin, and a few big spenders drag the average up to 42. Frequent discounts keep the headline number from dropping. Margins suffer, and the business becomes fragile.
Same average basket. Different distribution, pricing, and risk.
What Leaders Miss When They Only See Averages
Dashboards that show only averages can:
- Hide distribution changes, such as a shrinking middle
- Hide discounting that masks weaker willingness to pay
- Hide outliers that distort the mean and create false comfort
If you treat the mean as “typical” without checking these patterns, you may delay action until the damage is visible in profit and cash.
Rethinking “Typical” in Pricing and Demand
Typical can mean different things:
- Mean, median, or mode
- Before or after discounts
- By customer segment, not the whole base
Defensible decisions start with clear definitions. Before acting on a single number, you need to know which kind of typical you are using and what is driving it.
What the Professional Certificate in Business Analytics Does
The Certificate in Data-Informed Decision Making shows you how to:
- Pair averages with other summary statistics
- Visualize distributions to spot a hollowing middle or over reliance on outliers
- Separate price effects from true demand shifts
- Build interpretations you can defend to finance, product, and leadership
You learn to read the distribution behind each number, so your pricing, demand forecasts, and margin decisions are grounded in how the business actually behaves.
See how the certificate can sharpen your decisions: https://www.analyticstx.com/certificates